This tutorial walks you through the steps of creating a Java Application Health Check Example with Prometheus, Grafana, MySQL and Docker Compose.
What you'll need
- Docker CE 18+
Stack
- Java
- Prometheus
- Grafana
- MySQL
- Docker Compose
Init project structure and dependencies
Project structure
├── src
│   └── main
│       └── java
│           └── com
│               └── hellokoding
│                   └── monitoring
│                       ├── Application.java
│                       ├── DbHealthCheck.java
│                       └── HealthCheckExporter.java
├── Dockerfile
├── docker-compose.yaml
├── pom.xml
└── prometheus.yml
Project dependencies
Define and Export Health Check for Prometheus
Define Health Check
Extends Strengthened's HealthCheck and implements MySQL Database connection status checking method
Export Health Check for Prometheus
Start a simple HTTP Sever by using Jetty, listening connection on port 8080 and expose health check through /metrics end point.
Glue things together
Create a HealthChecksCollector with metric name as hello_koding_health_check (to be use as a key to query on Prometheus and Grafana), add above health check definition to the collector and trigger export function.
Prepare Dockerfile to build the Java application
Prepare docker-compose.yaml to provision MySQL, Prometheus and Grafana
Start your application and infrastructure via Docker Compose. Make sure your local Docker is running
docker-compose up
Access to localhost:8080/metrics, you should see something like this in the console
# HELP hello_koding_health_check Health check status results
# TYPE hello_koding_health_check gauge
hello_koding_health_check{system="database",} 1.0
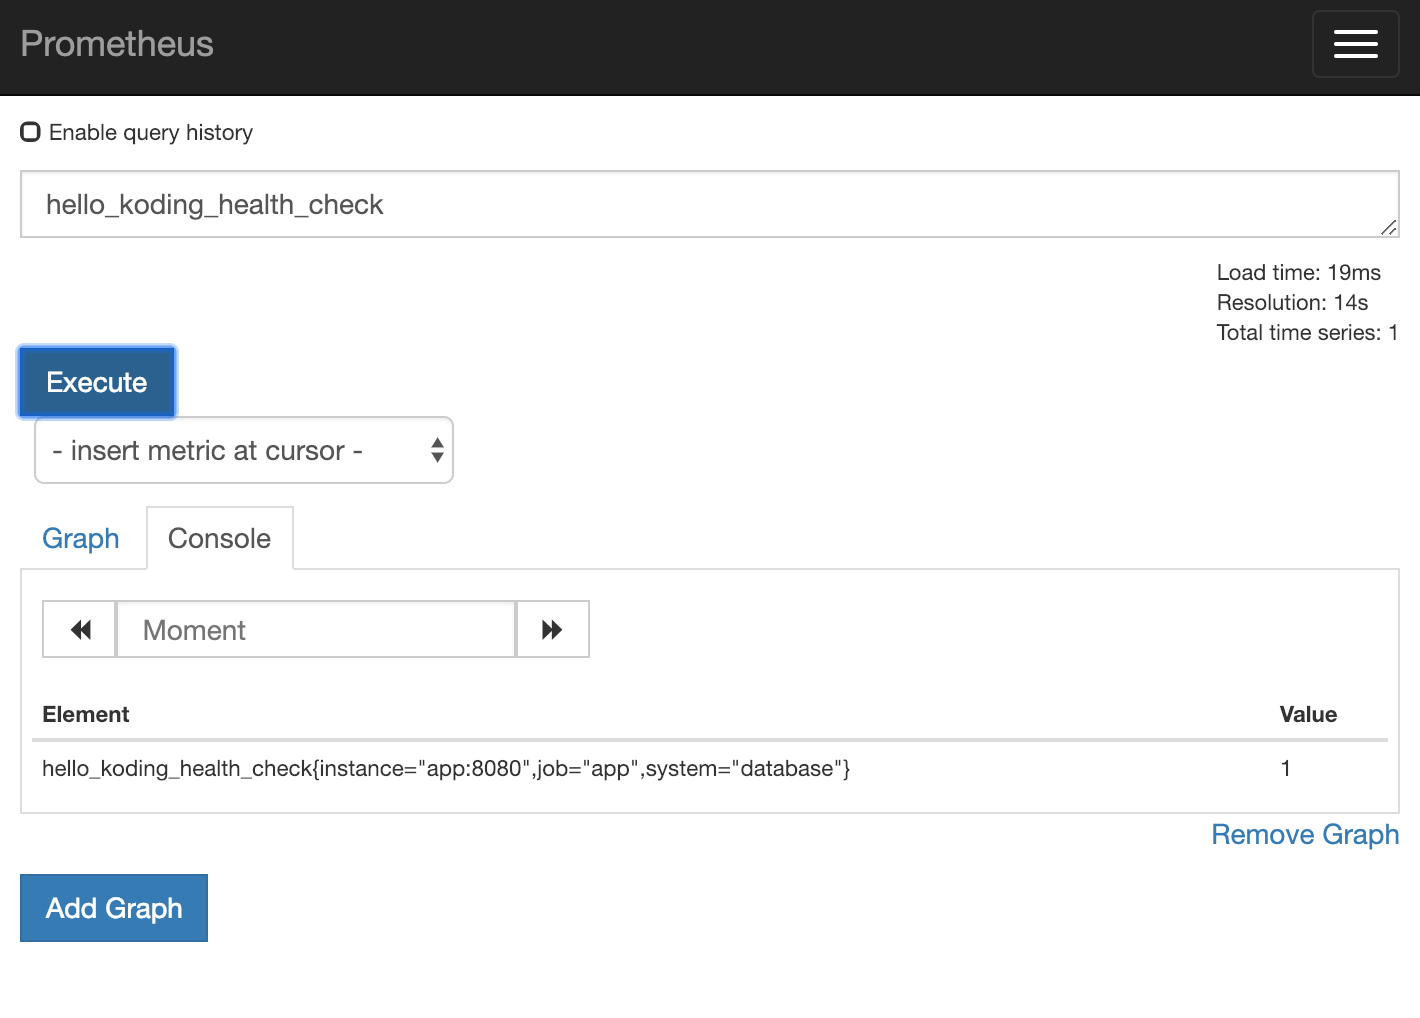
Access to Prometheus console through localhost:9090

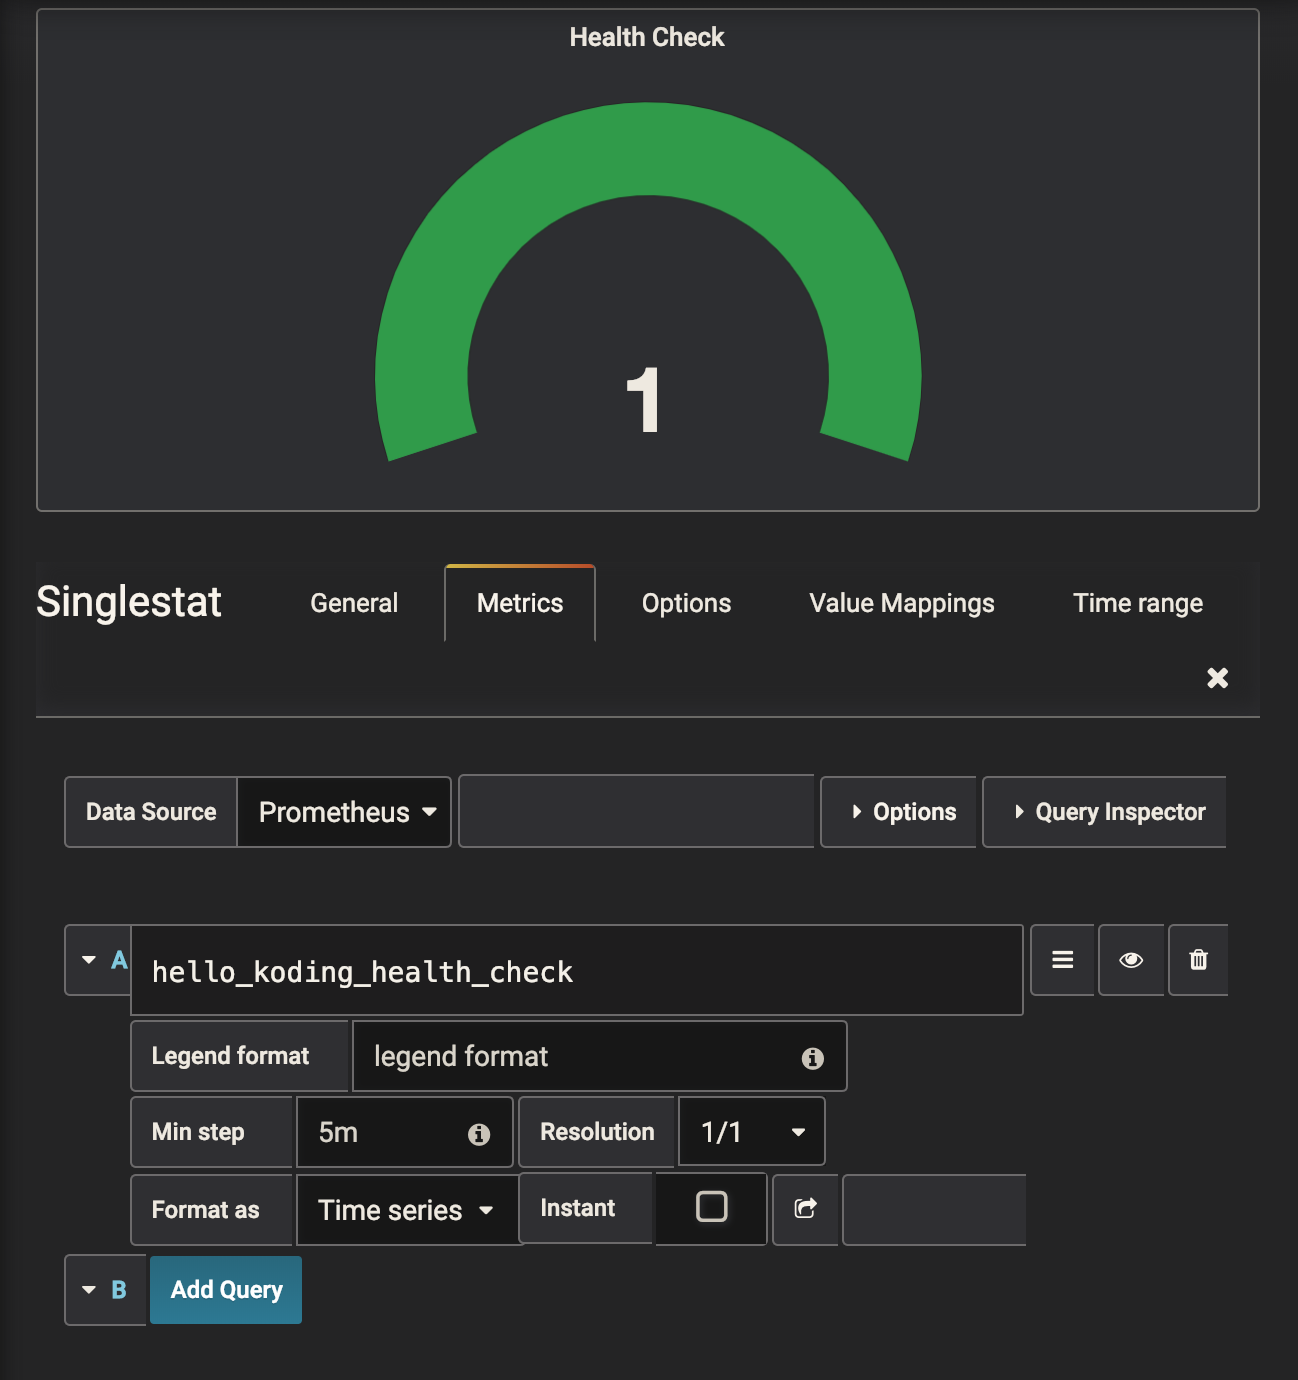
And finally access to Grafana through localhost:3000

